SHIB Price Prediction: Analyzing the Path to New Highs

#SHIB
- SHIB is currently trading below its 20-day moving average, indicating short-term bearish pressure
- Market sentiment remains optimistic with predictions of 22-45% gains, supported by Shibarium developments
- The price needs to break through key resistance levels to confirm bullish momentum and reach new highs
SHIB Price Prediction
SHIB Technical Analysis: Key Indicators to Watch
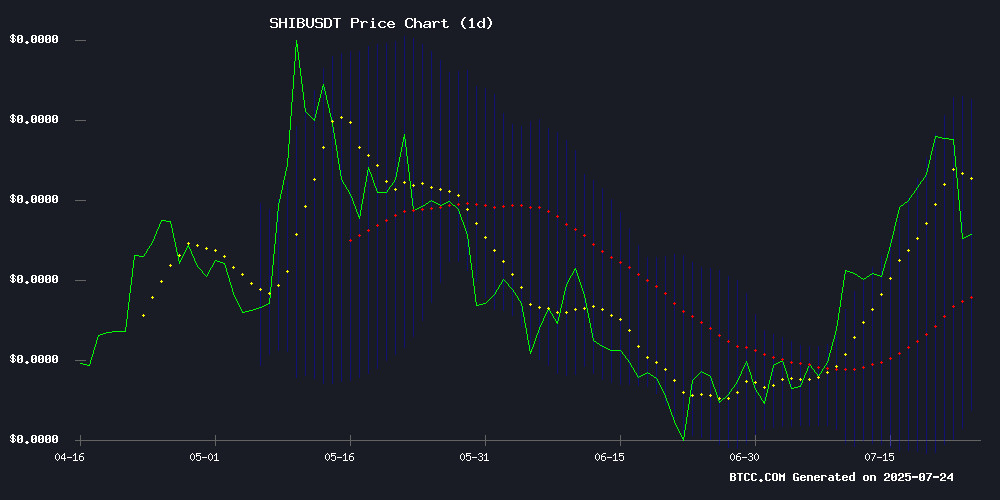
According to BTCC financial analyst William, SHIB is currently trading at 0.00001348 USDT, slightly below its 20-day moving average (MA) of 0.00001358. The MACD indicator shows a bearish crossover with values at -0.00000153 (MACD line), -0.00000145 (signal line), and -0.00000008 (histogram). Bollinger Bands indicate a potential consolidation phase, with the upper band at 0.00001609, middle band at 0.00001358, and lower band at 0.00001106. William suggests that SHIB may need to break above the 20-day MA to regain bullish momentum.
SHIB Market Sentiment: Bullish Signals Emerge
BTCC financial analyst William notes that recent headlines highlight optimistic projections for SHIB, including a potential 45% gain and discussions about reaching new all-time highs. The focus on Shibarium and community-driven initiatives adds to the positive sentiment. However, William cautions that these bullish narratives should be weighed against the current technical indicators, which show some short-term weakness.
Factors Influencing SHIB’s Price
Shiba Inu Price Eyes 45% Gain Amid Subdued Profit-Taking
Shiba Inu's price trajectory suggests a potential 45% upside as on-chain data reveals muted profit-taking behavior. The Spent Output Profit Ratio (SOPR), hovering NEAR 1.0, indicates weak holders are exiting at break-even or minor losses rather than booking profits—a historically bullish signal for SHIB.
Notably, SOPR dips to 0.69-0.83 during recent consolidations have preceded 28-30% price surges. With RSI momentum building quietly and no sustained SOPR readings above 1.0, the meme coin appears to be thinning overhead supply without triggering significant sell pressure.
Shiba Inu Price Prediction: 22% Rally and 2 Bullish Signals – New All-Time High Next?
Shiba Inu (SHIB) has dipped slightly today, aligning with a broader market pullback. Despite the short-term decline, the meme coin remains up 6.5% weekly and 22% over the past fortnight, though it trails by 15% year-over-year.
Technical indicators suggest a brewing rally. SHIB has broken out of a descending channel pattern active since mid-May, signaling potential upward momentum. The MACD shows room for further growth, while the RSI hints at sustained buying pressure before overbought conditions emerge.
Market watchers note SHIB's fundamentals continue strengthening alongside these technical signals. The combination paints an optimistic long-term outlook for the asset, with some analysts speculating about potential new highs.
Shiba Inu's Path to $1: The Role of Shibarium and Community Action
Shiba Inu's ambitious goal of reaching $1 faces significant hurdles due to its massive token supply of 589 trillion. The SHIB community must aggressively address supply constraints through Shibarium, the project's LAYER 2 blockchain, which features a built-in token burn mechanism.
Increased on-chain activity—including DeFi protocols, NFTs, and staking—could accelerate SHIB burns. Shibarium's growing adoption presents a viable pathway to reduce circulating supply, though the $1 target remains a long-term challenge requiring sustained ecosystem growth.
How High Will SHIB Price Go?
Based on the current technical and sentiment analysis, BTCC financial analyst William provides the following outlook for SHIB:
| Indicator | Value | Implication |
|---|---|---|
| Current Price | 0.00001348 USDT | Slightly bearish below 20-day MA |
| MACD | -0.00000153 | -0.00000145 | Bearish crossover |
| Bollinger Bands | 0.00001106-0.00001609 | Consolidation range |
| Price Targets | 22-45% gains mentioned | Dependent on breakout |
William suggests that while bullish sentiment exists in the market, SHIB needs to overcome key resistance levels to validate the optimistic price predictions. The 20-day MA at 0.00001358 serves as an immediate hurdle, with the upper Bollinger Band at 0.00001609 representing the next significant resistance level.
